The Ultimate in
Volleyball Stats
After nearly 15 years as the #1 volleyball stats app, an entirely new iStatVball has arrived. Choose between the brand new RallyFlow™ system or the iStatVball 2 Legacy system.


Patent pending RallyFlow™ recording system


Cutting edge stats at a fraction of the cost and learning curve
You now have access to the same stats found in software used by elite Division 1 college programs except at a fraction of the cost and learning curve. If your opponent has these stats and you don't… you're at a disadvantage!

Shot Charts
Easy to read shot charts for all ball contacts. Visualize set distribution, pass location, and of course hitting and serving. View charts by individual player or for the team as a whole. Chart individual sets, matches, or an entire season. Full opponent shot charts as well!

Opponent Stats
All the same stats and charts you have for your team you also have for the opponent. Except broken down by rotation rather than player. See your opponent’s tendencies and weaknesses in real-time during the match! Where’s their weak spot on serve receive? Where are they most likely to hit?
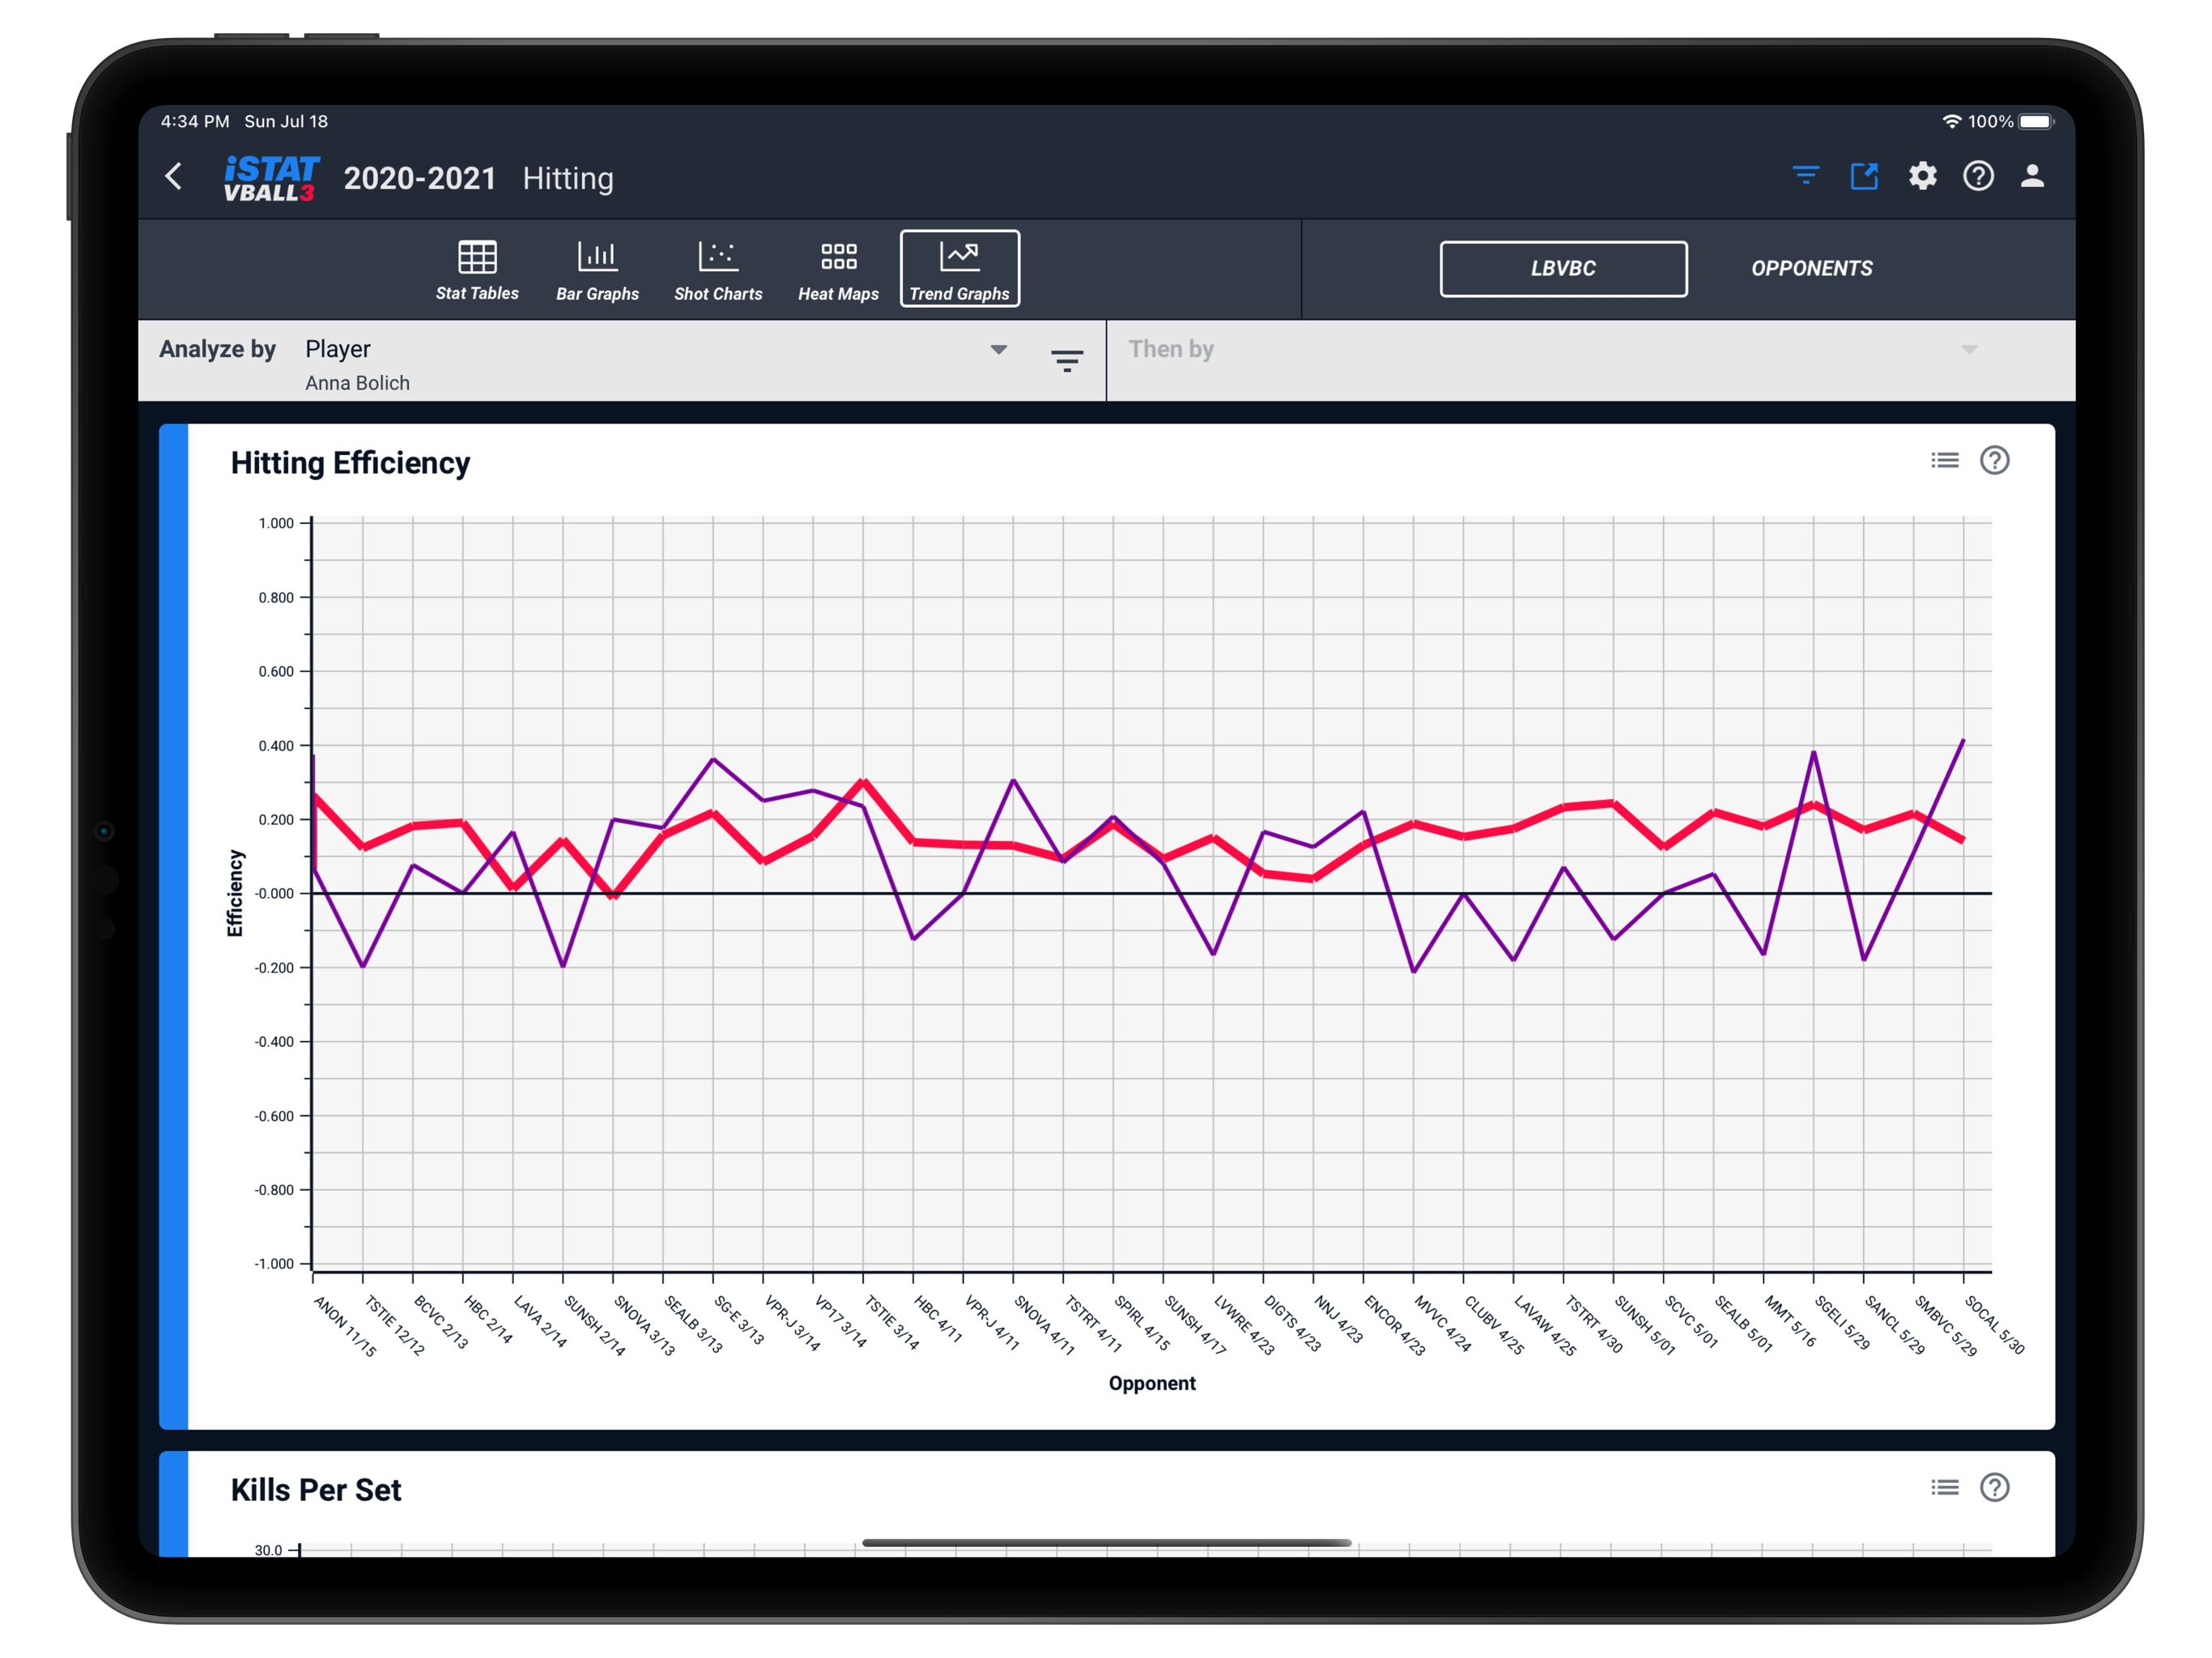
Trend Graphs
Track the progress of any stat over the course of a match, tournament, or entire season. Easily compare progress between players or a player versus the team. Easy to read legend. Works for opponent trends as well!
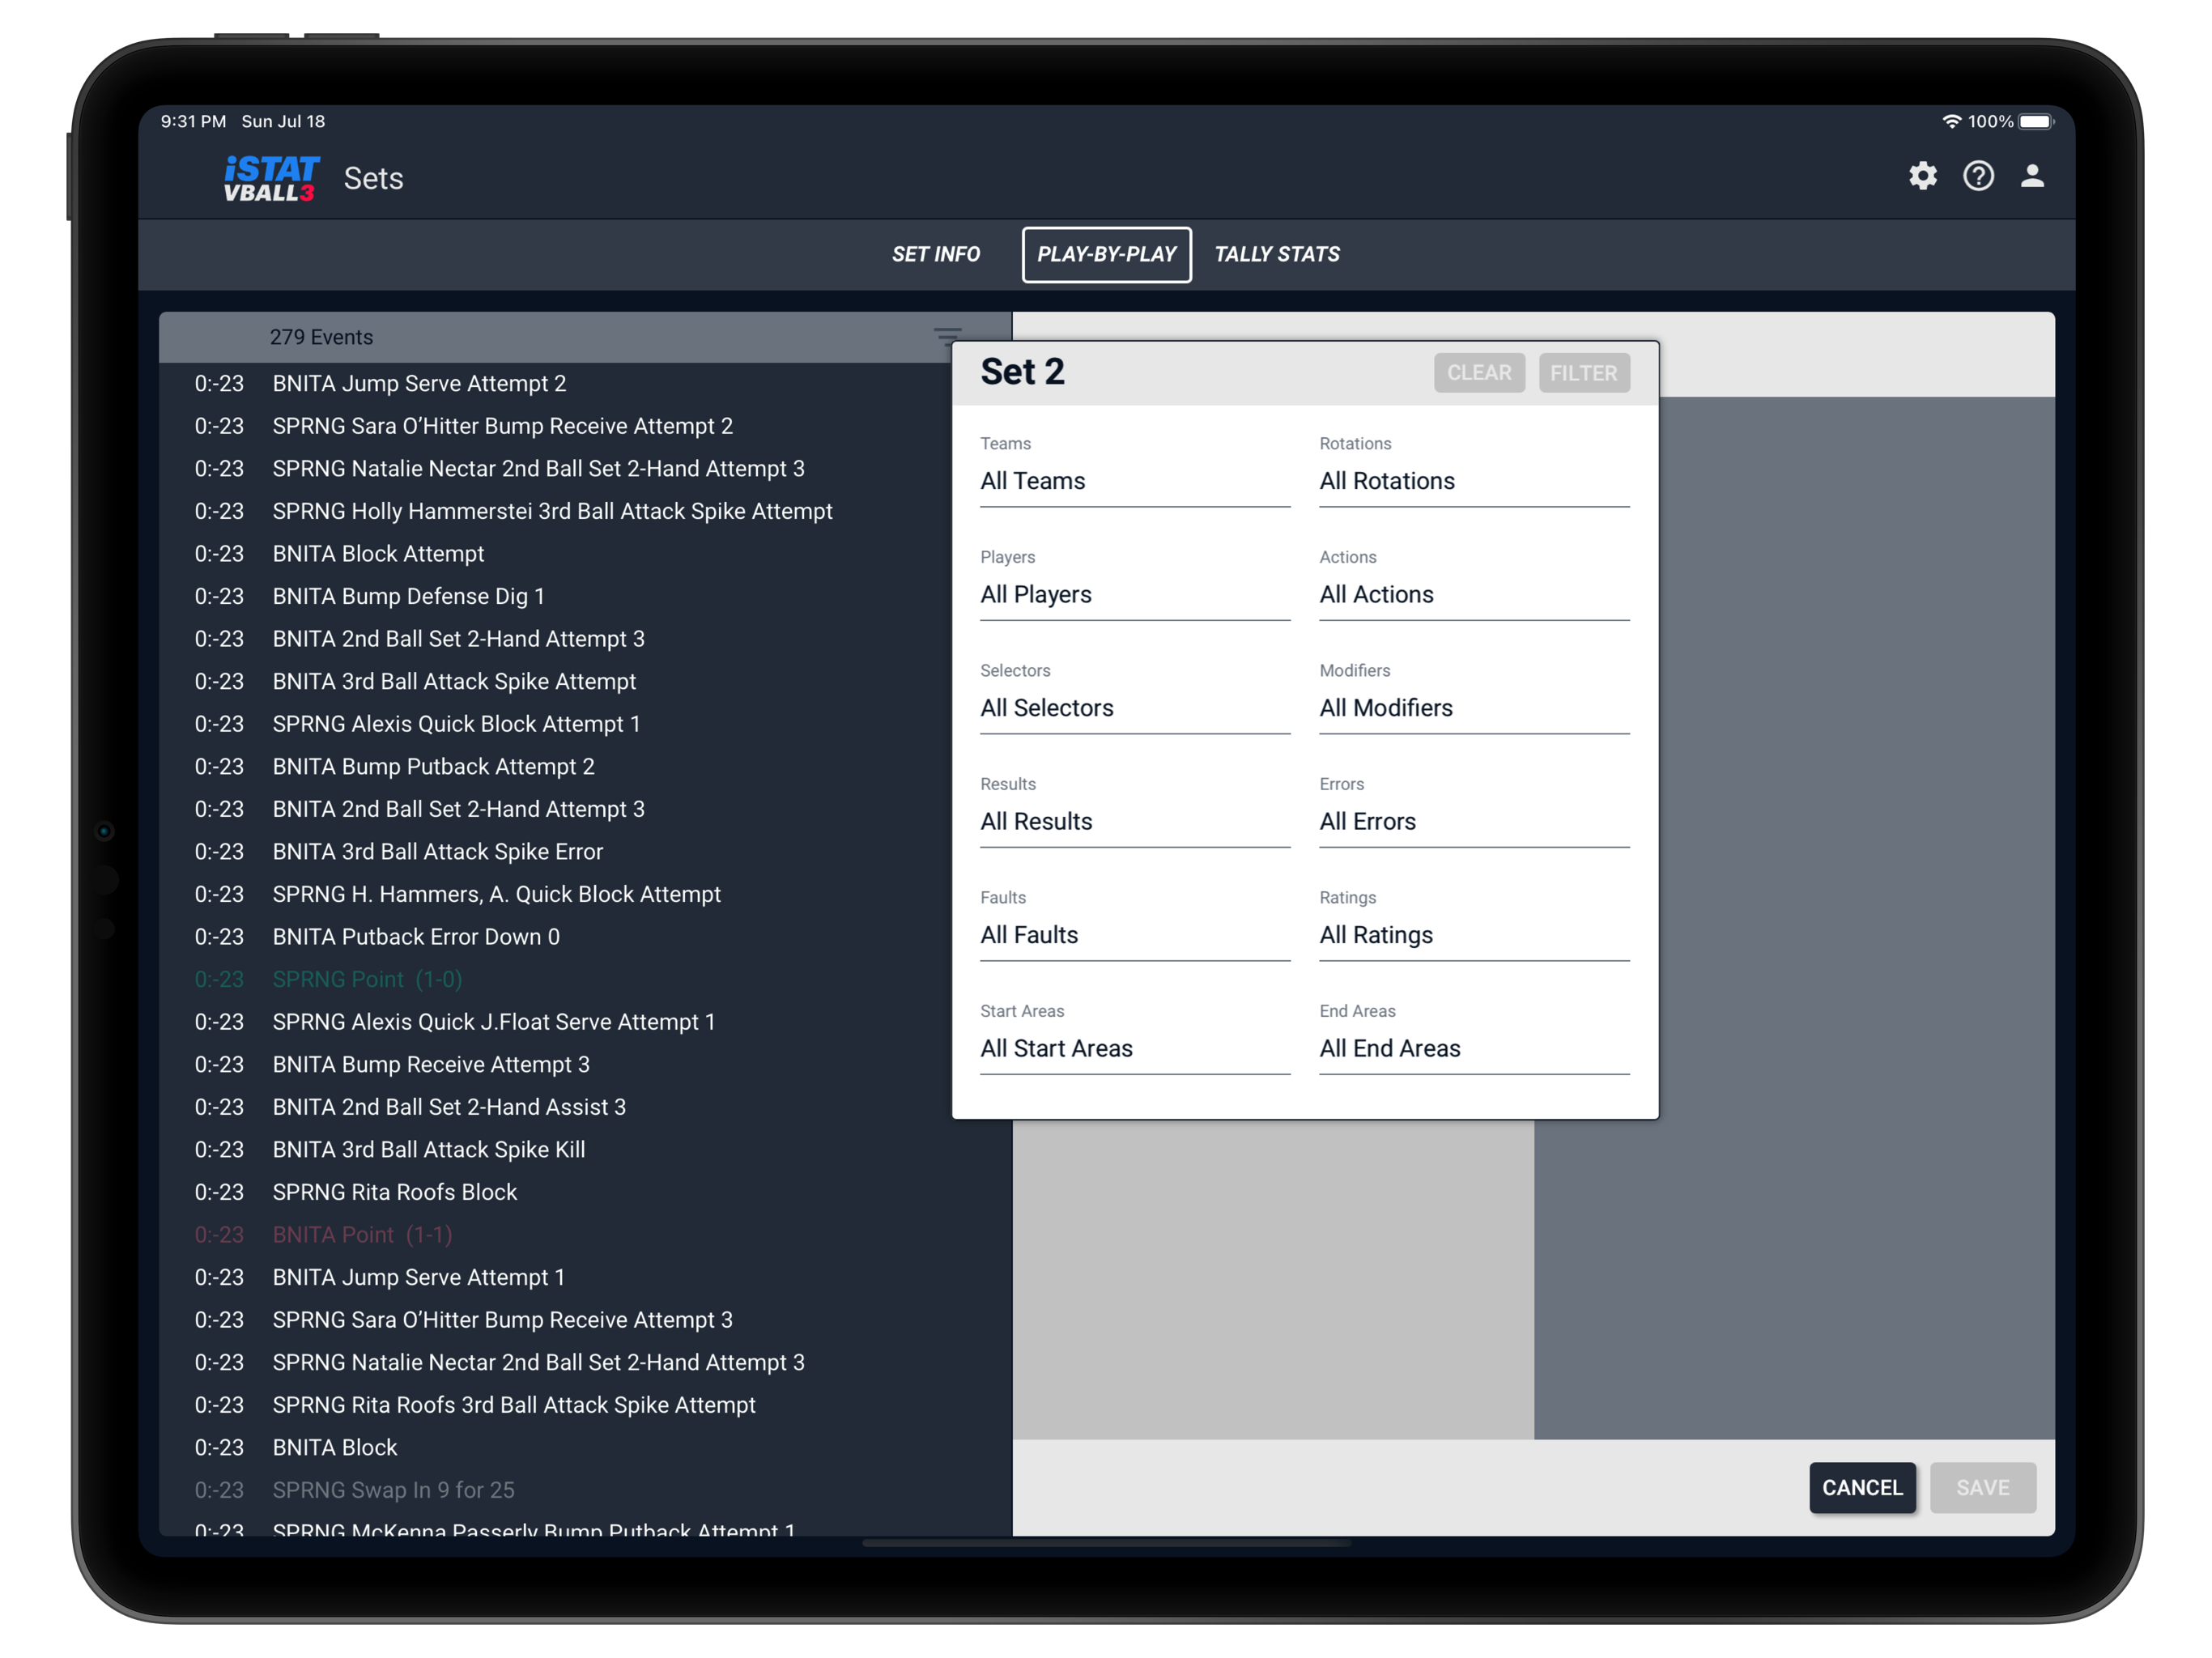
Play-by-Play
View a complete play-by-play log showing detailed information about every ball contact and point. Available Live while recording stats or after-the-fact. Filter the PbP by team, player, action, result, and more. Edit basic stats directly in the PbP.
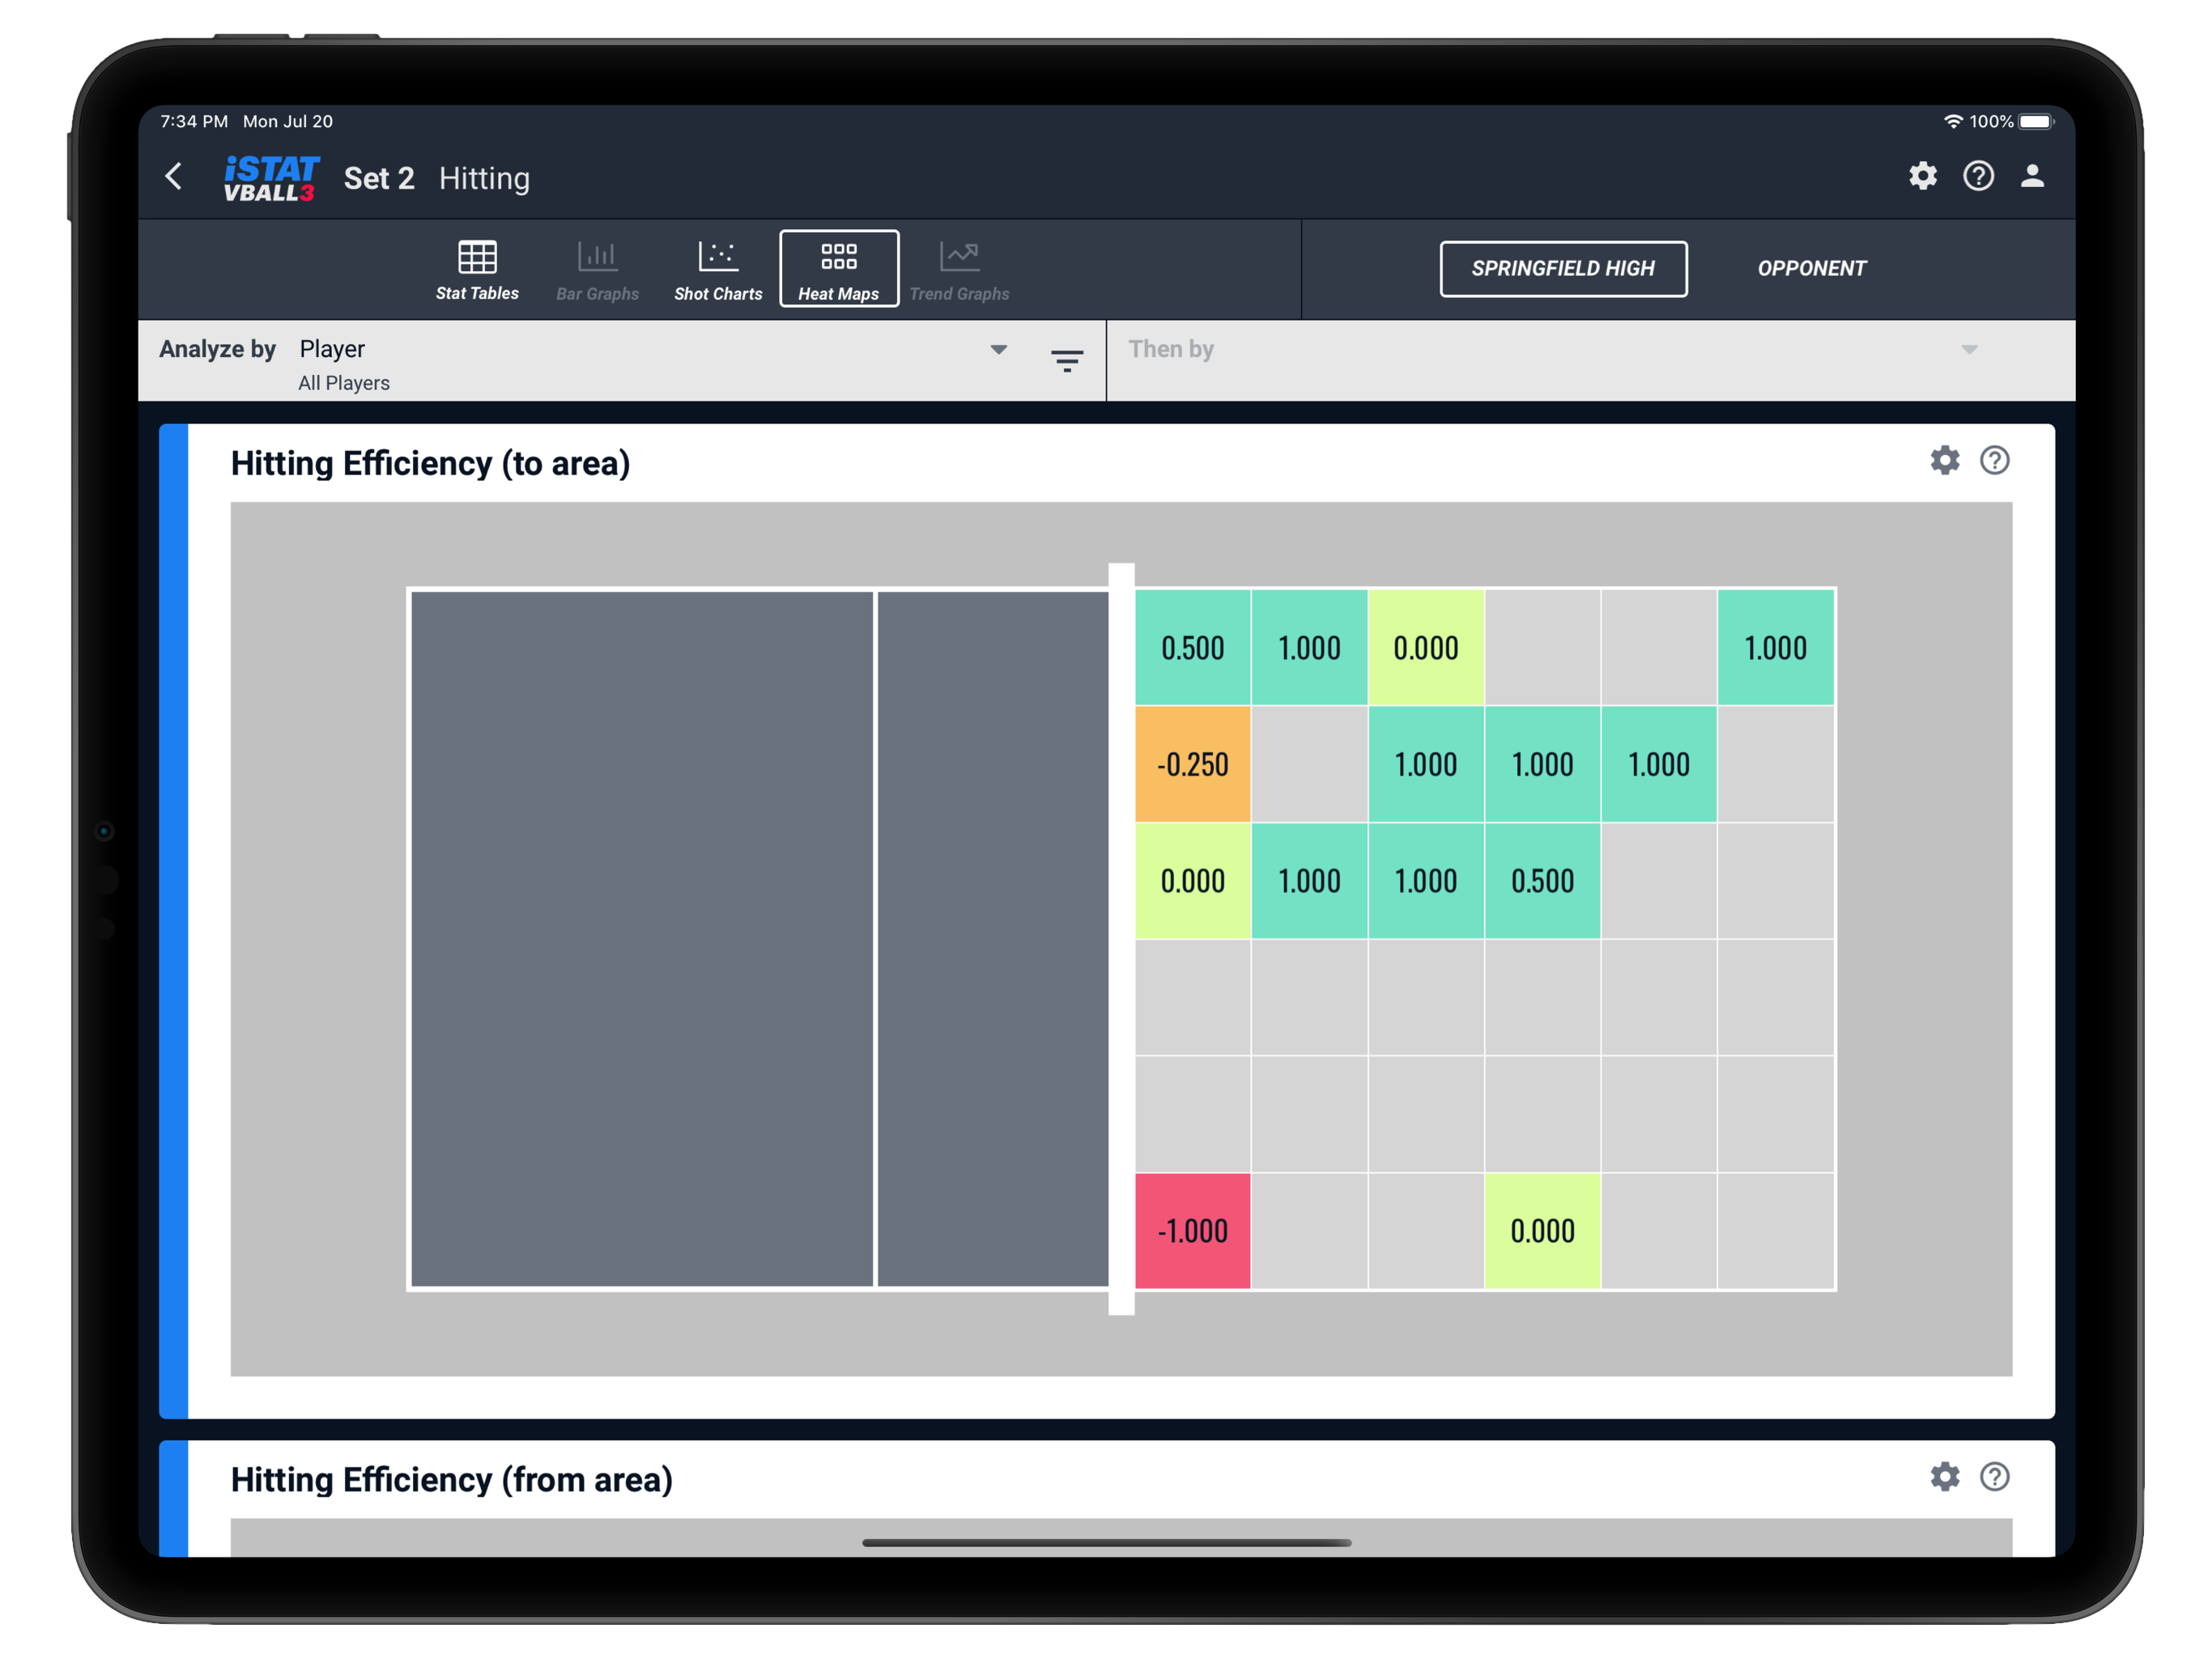
Heat Maps
See your statistics broken down by court area. What area of the court is your team hitting most effectively to? Where is your opponent passing worst? View maps by individual player, team, or opponent. Customize the detail level. View cumulative maps by set, match, or season!
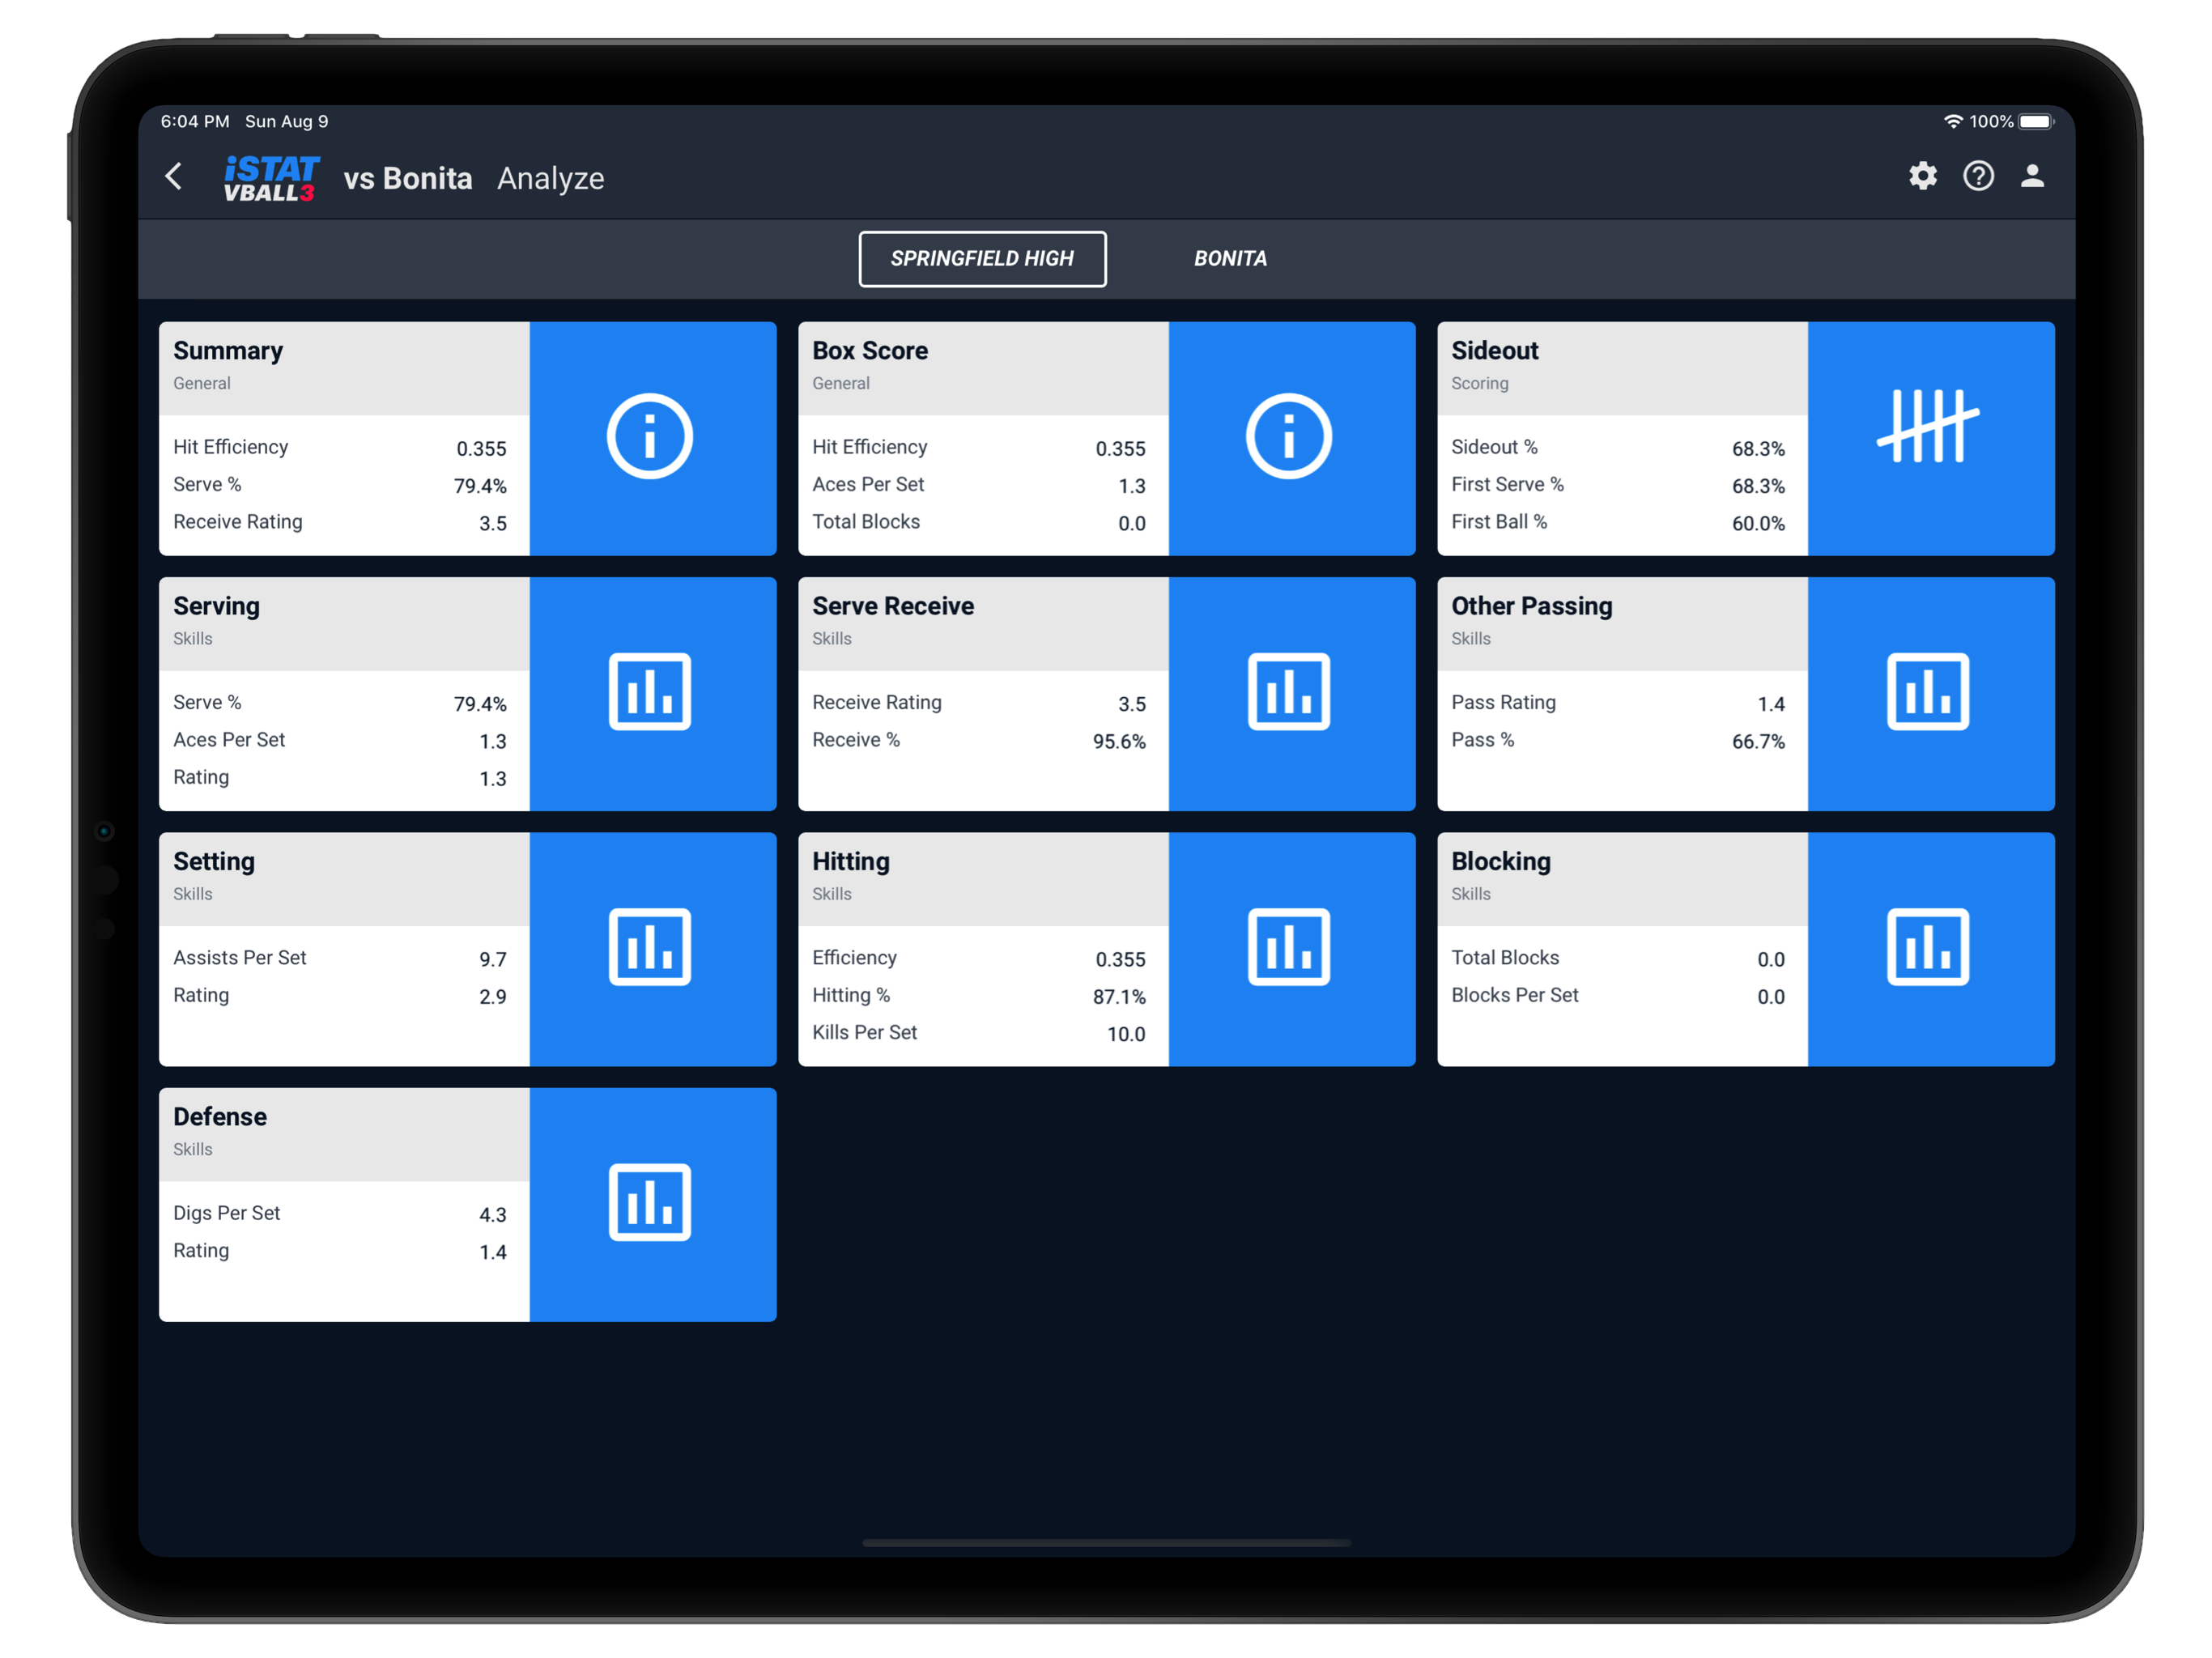
Comprehensive Stats
All stats can be broken down by player or rotation. Full sideout stats for both teams. Box scores, +/- scoring, playing time, and much, much more. Analyze cumulative stats by tournament or an entire season. Track career stats across multiple seasons or across multiple teams.
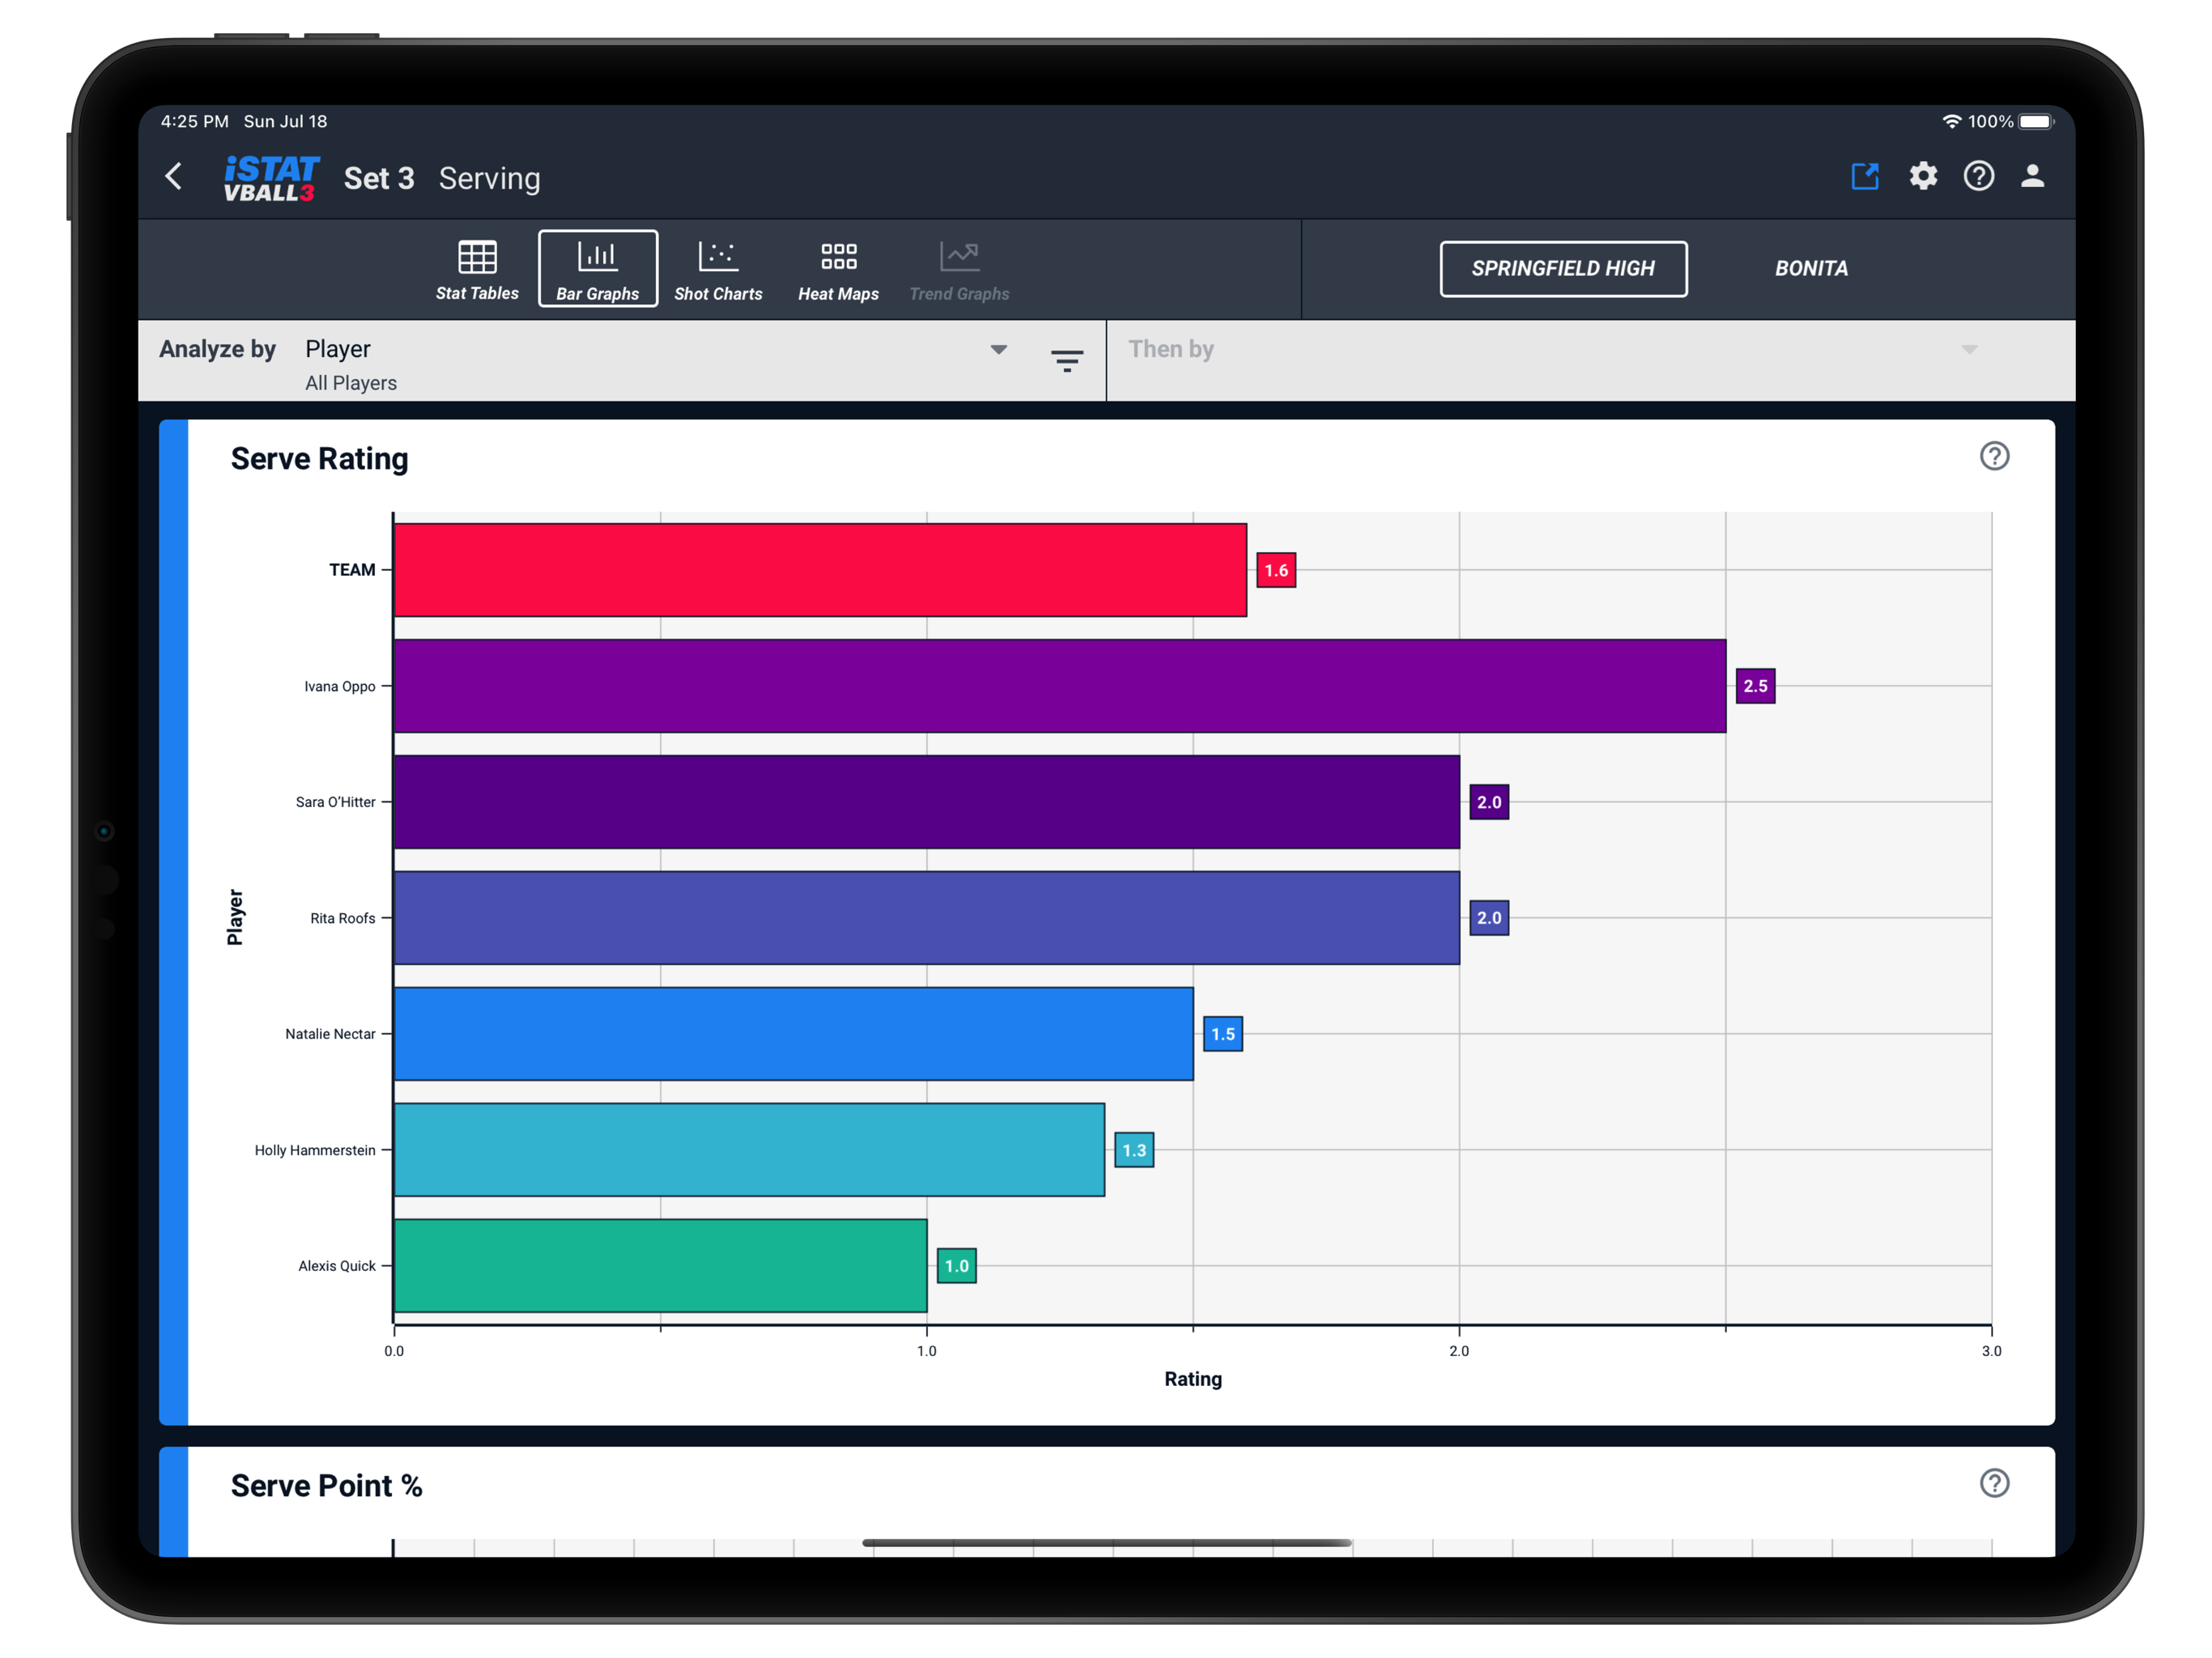
Bar Graphs
Easy to read bar graphs let you visualize every available stat for both your team and the opponent. A great way to quickly compare players without having to scan through a stat table. Instantly find your best passer, most effective hitter, etc.
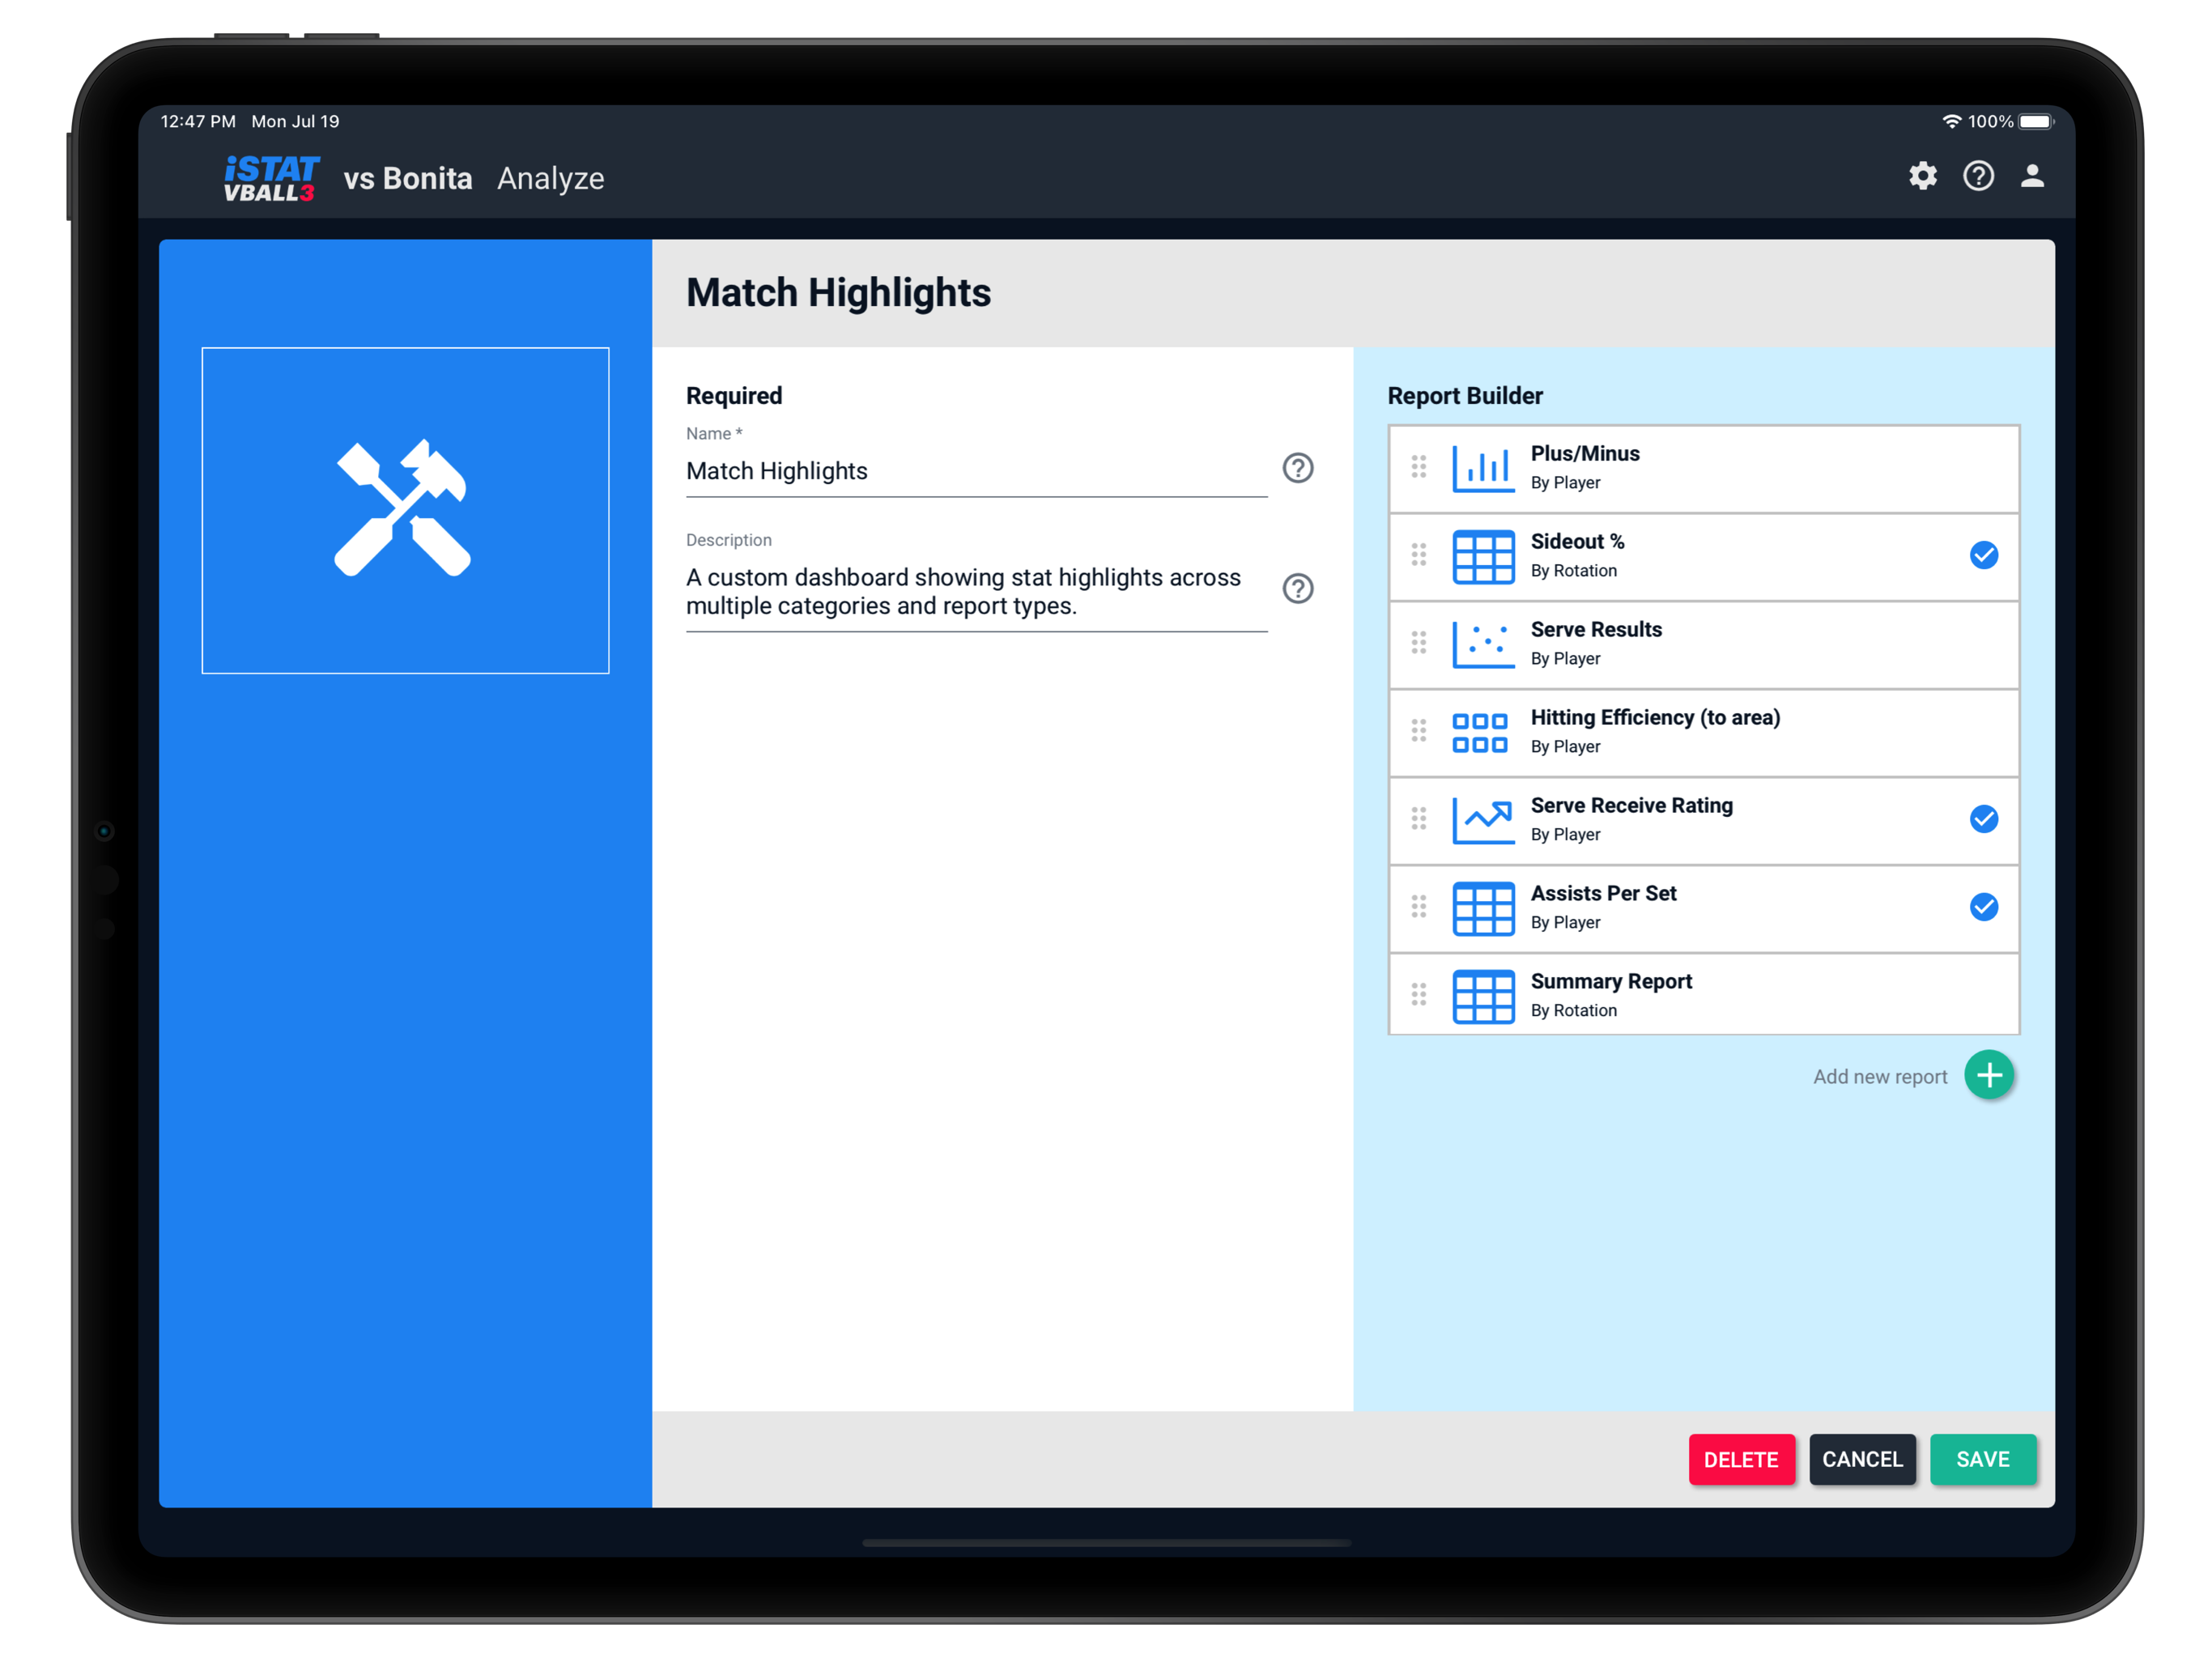
Custom Reports
Create your own custom report dashboards with any combination of stat categories. Choose from any combination of stat tables, charts, and graphs. Then give your players access or export beautiful full-color PDFs.
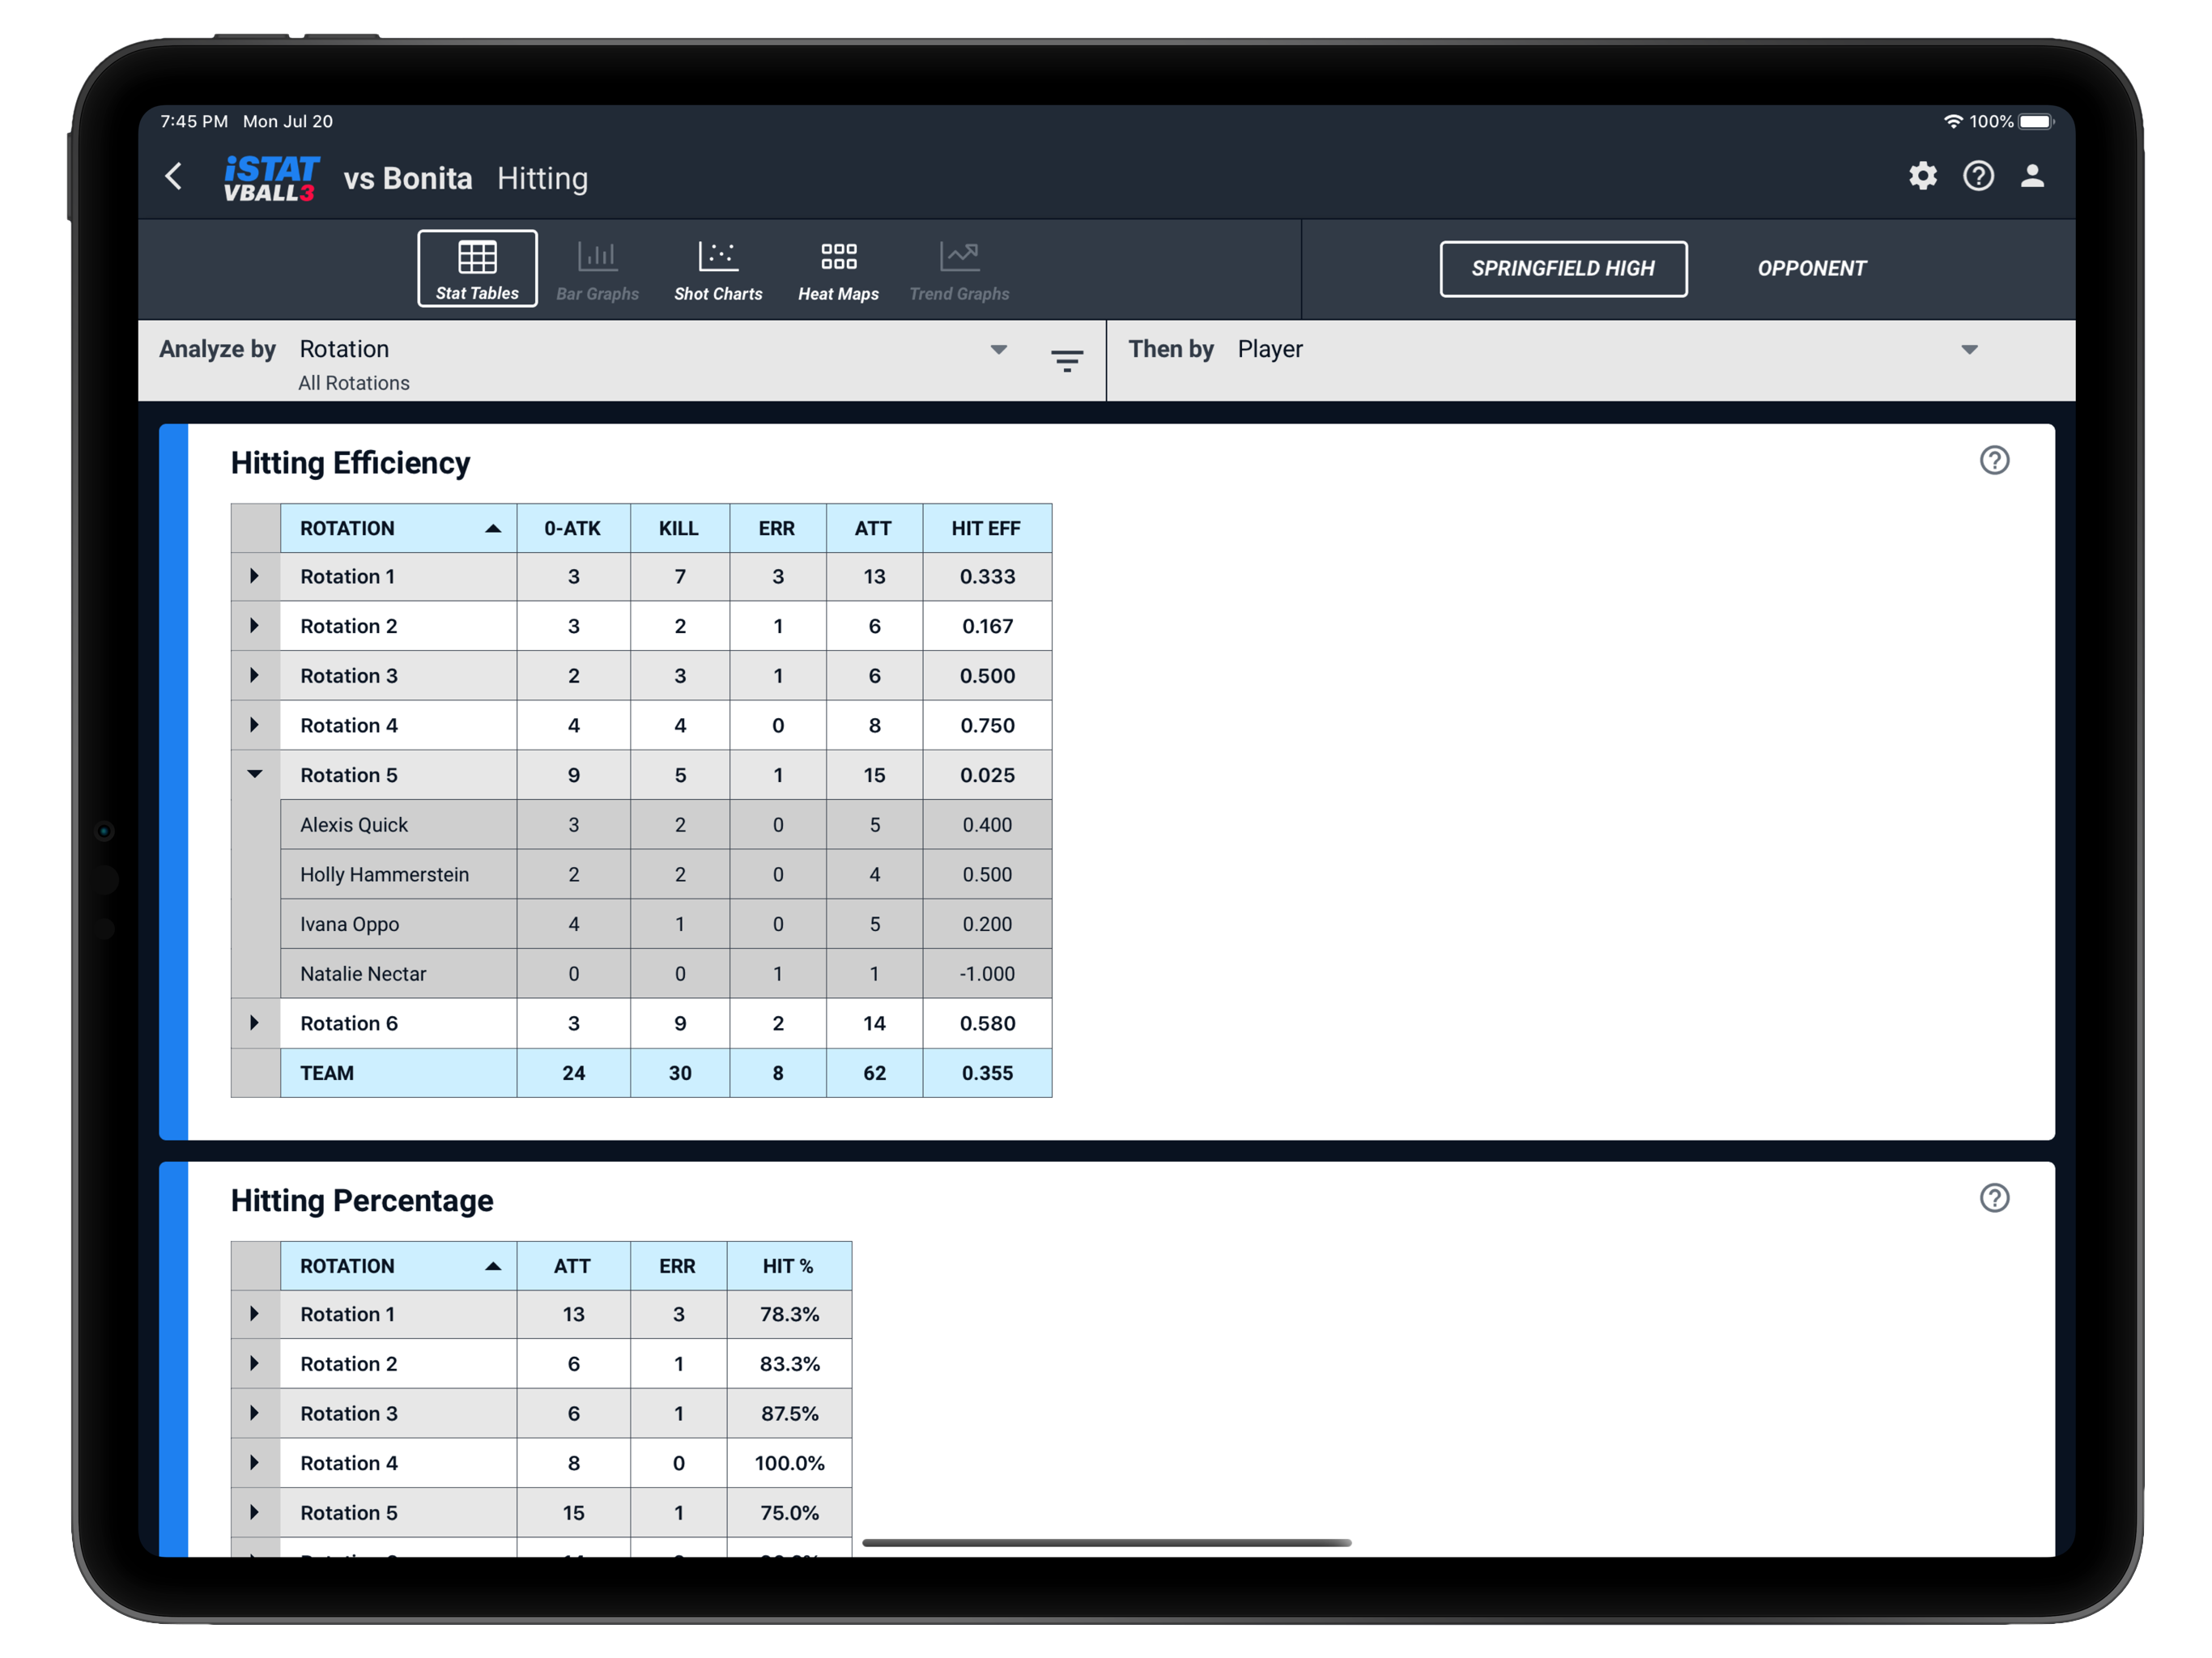
Advanced Stat Tables
Easy to read stat tables with sorting, locking columns, and more. Expandable rows allow you to drill down deeper into your data. Have a weak rotation on serve receive? Expand to see exactly which player is the cause. View any stat by player, by rotation, or by contact type.

Real-Time Stats
All stats and charts are available in real-time during the match. Don’t settle for stats 24 hours later. Good coaches know you need stats on the bench to make the best in-game decisions. You can even view stats on your device while a statistician is recording stats elsewhere!
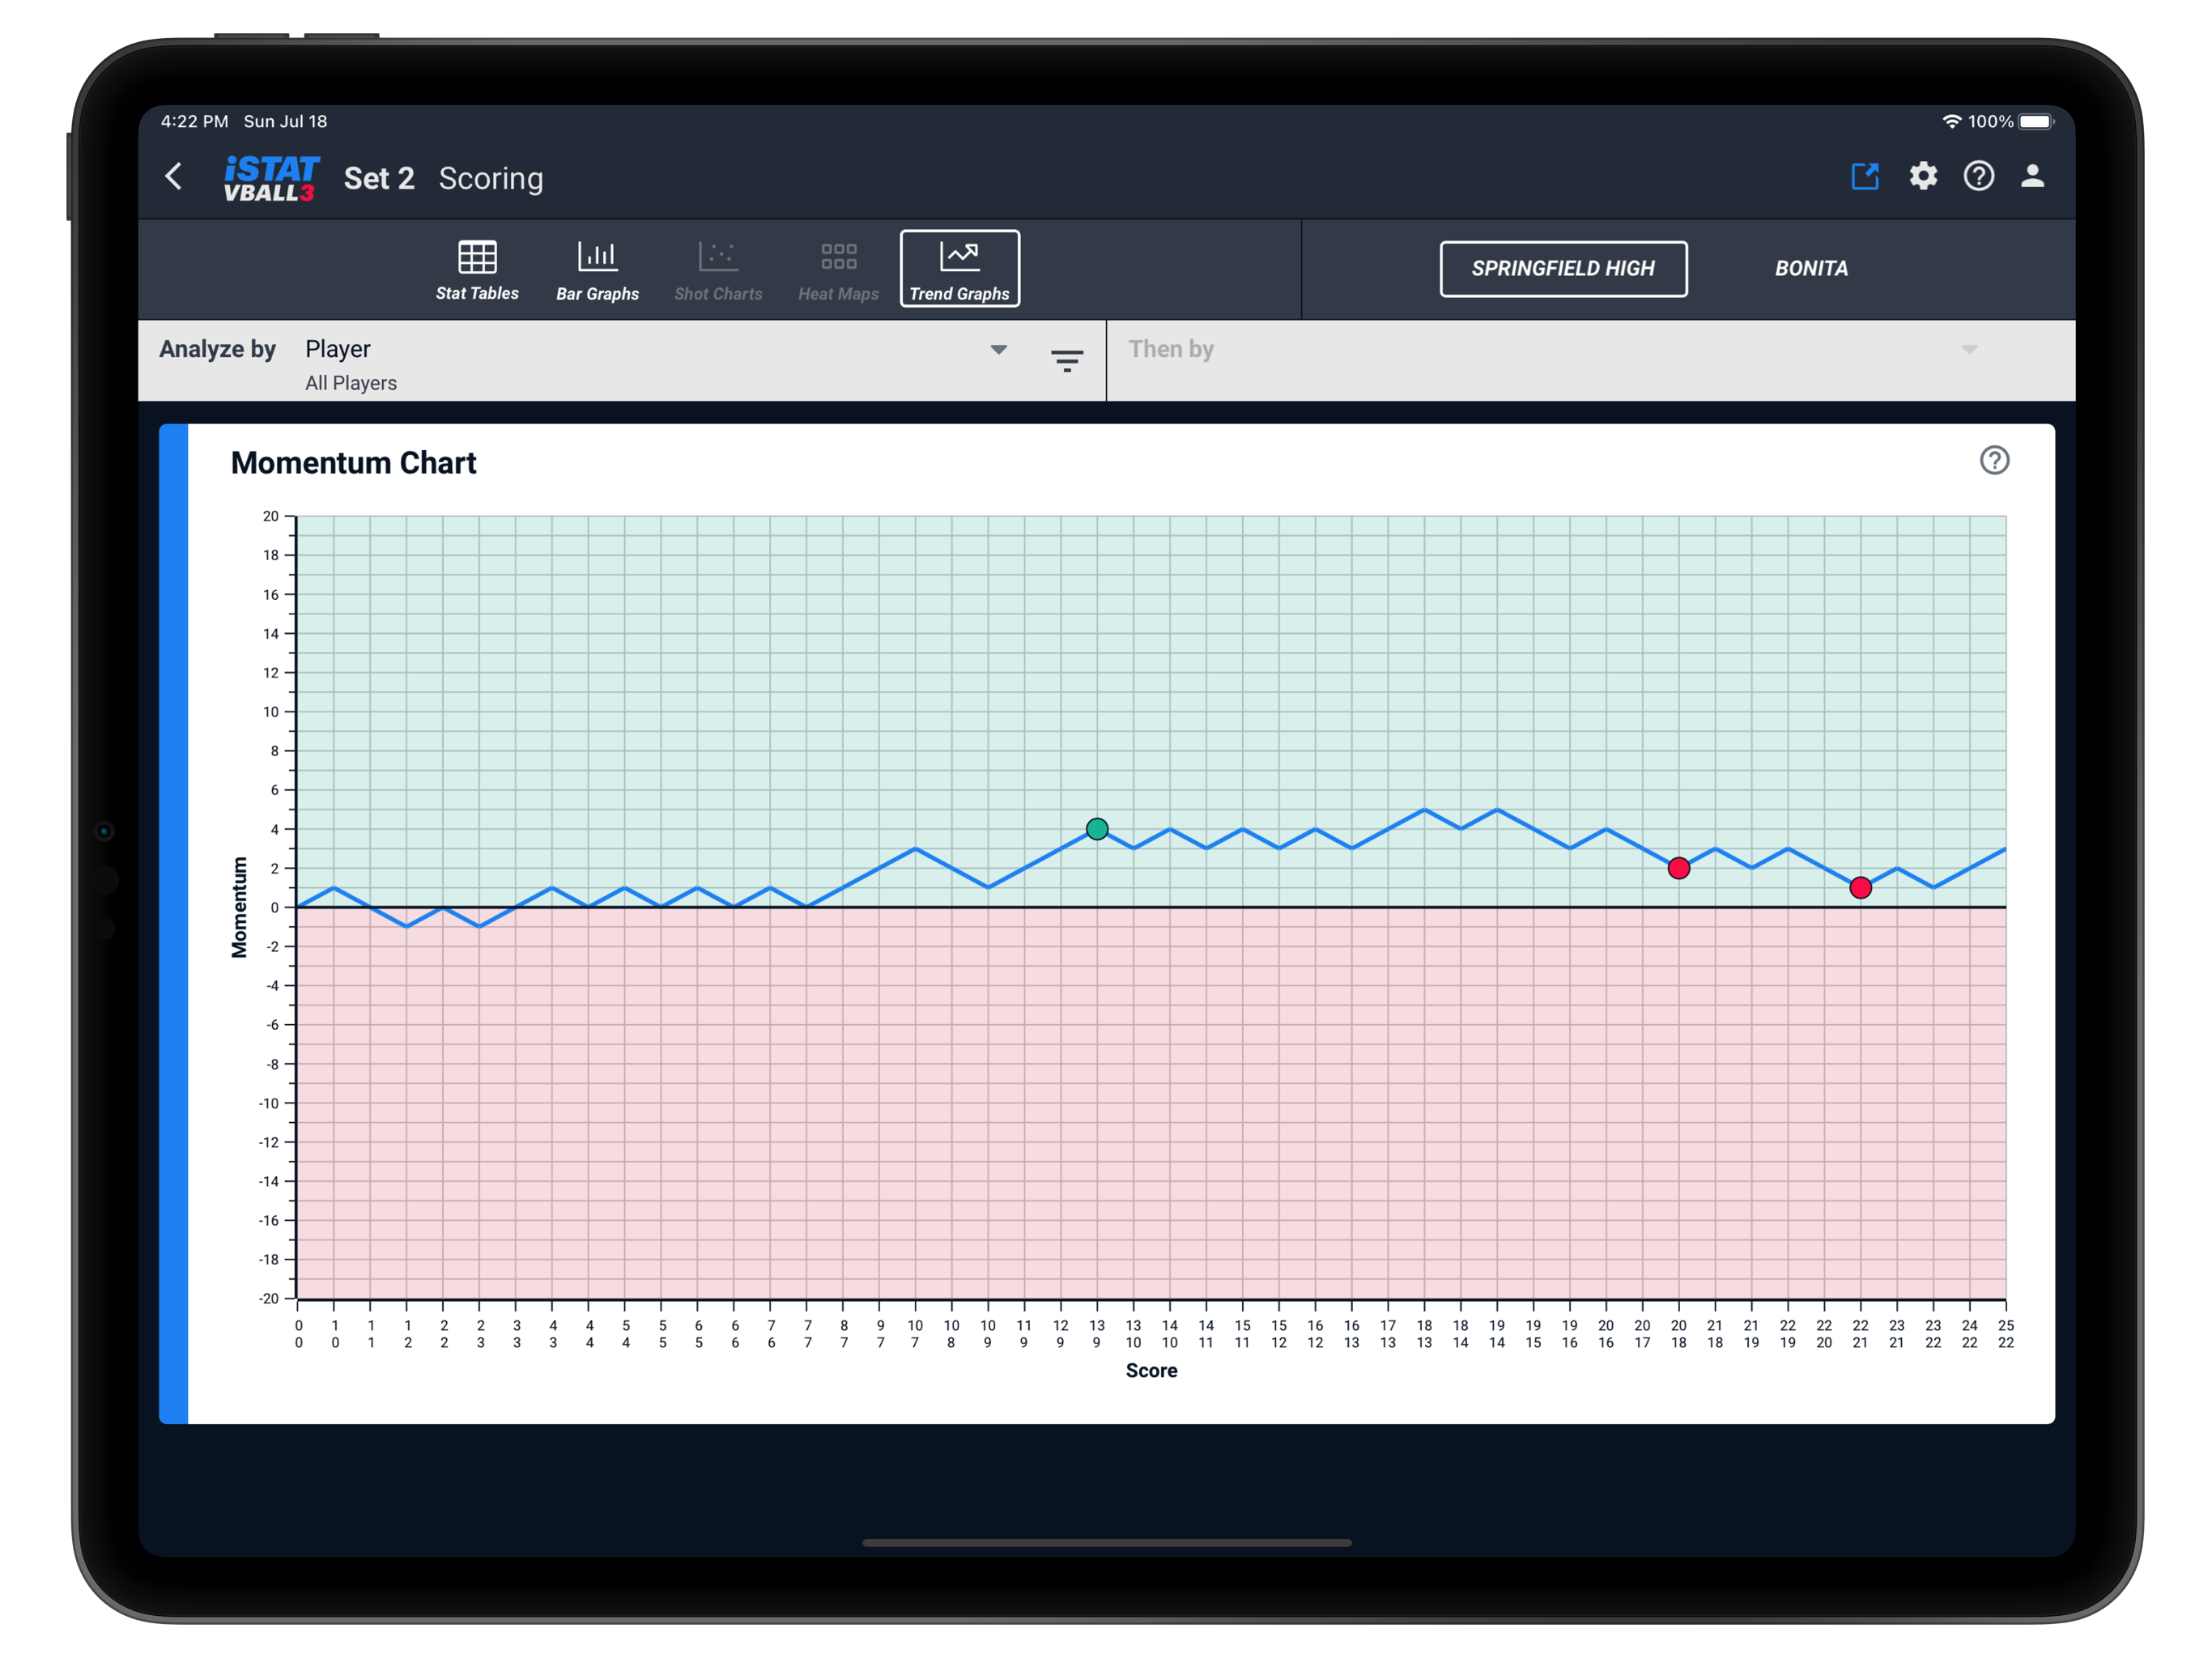
Momentum Charts
Does your team always seem to start slow? Now you can visualize the ebb and flow of your scoring over the course of a set. And see how timeouts and substitutions affect momentum. A great indicator of both momentum and morale.
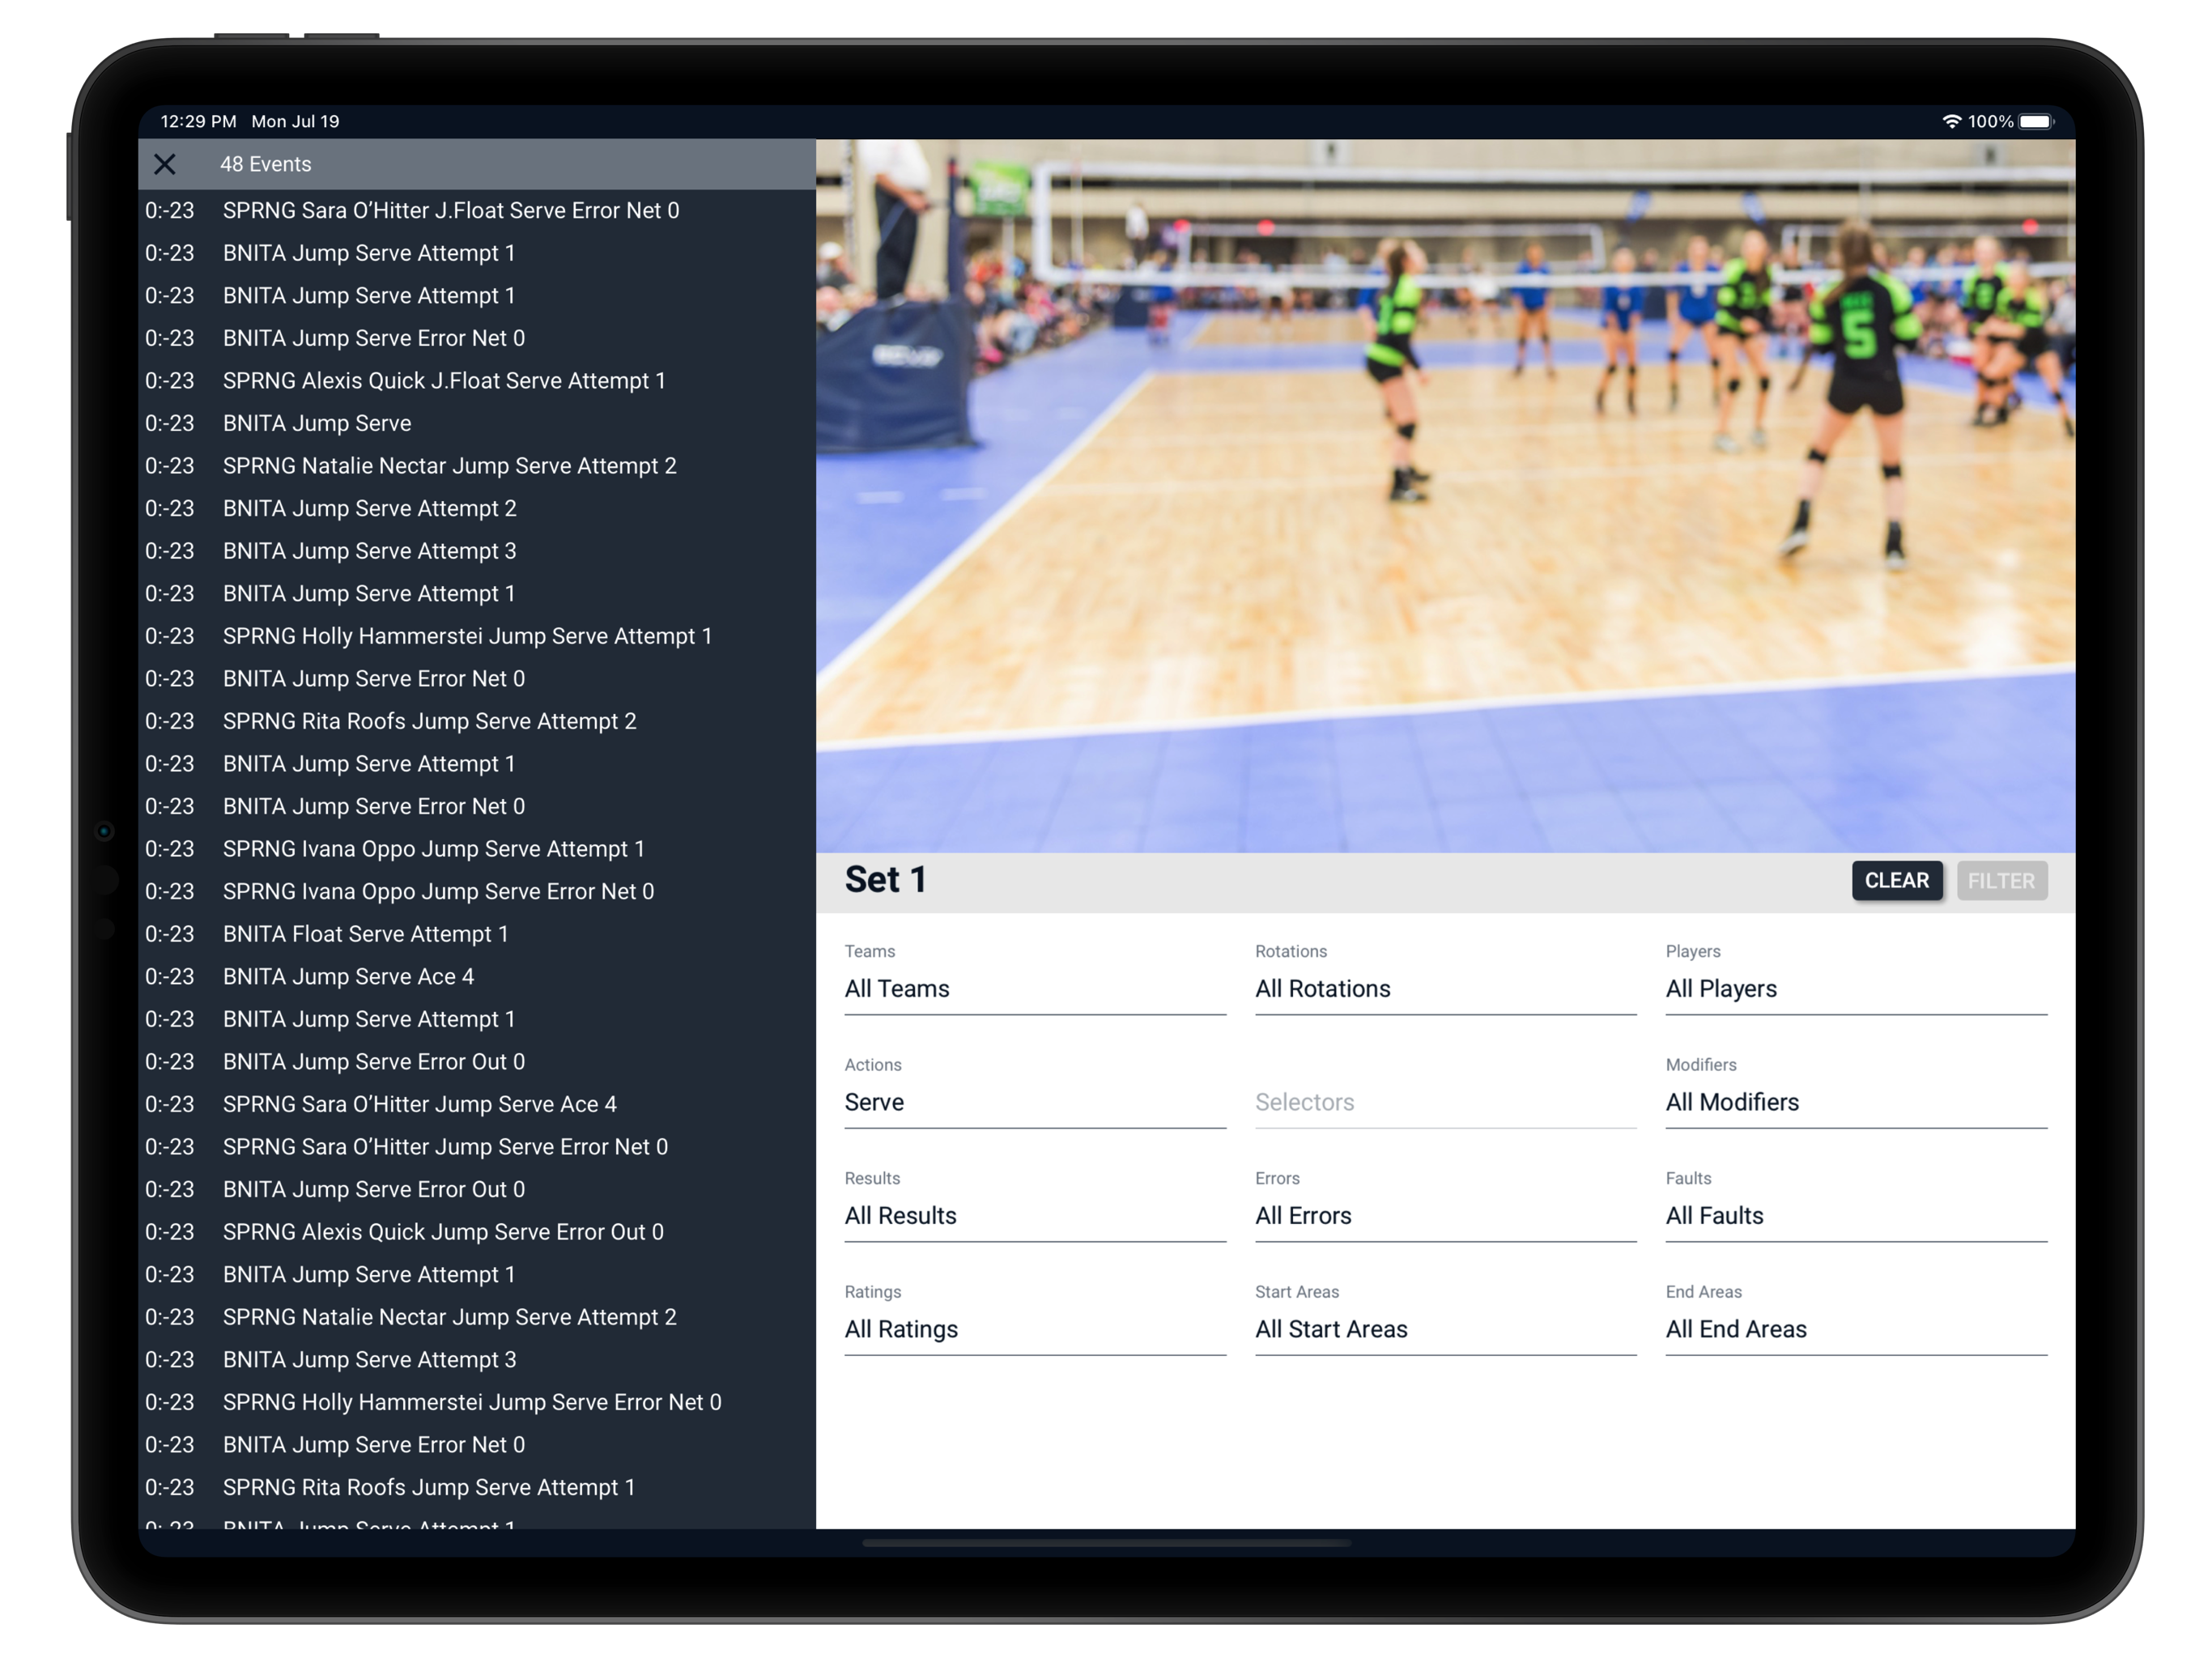
Video Sync
Sync your stats to video. Record stats directly alongside video on tablet devices or sync to pre-recorded video. Then filter by team, rotation, player, action, result, court location, and more to jump directly to an exact point in the video!
Unmatched features and support


See what your fellow coaches have to say...
Coach Ryan M.
Varsity Coach- Lincoln Way Central HSHead Coach- Club 1 VBC

Whitman C.
Sports Information Director- Siegel High School
Coach Peter M.
Club Director- Oklahoma Premier
Coach Andrew V.
Varsity Head Coach- Chillicothe High School
Coach Stuart P.
Varsity Asst- Ladysmith High School
Coach Keith S.
Varsity Head Coach- Kuemper CatholicClub Director- Carroll Thunder
Coach Neal E.
Varsity Coach- Providence Christian AcademyHead Coach- Intensity Volleyball Club
Download now and start your 14 day FREE trial
Purchase new seasons whenever needed. No auto-renewing subscription required.